By Eleanor Frajka-Walliams
The MSM121 cruise is part of a larger effort to understand the ocean currents found in the Atlantic. When you visit the beach, you may be familiar with waves and tides and know that the water is moving around a bit. Perhaps you’ve also heard of the Gulf Stream which is a northward flowing current off the east coast of the USA and is sometimes featured in the news. Unlike waves and tides, which can slosh around within seconds or hours, the Gulf Stream sometimes appears as a relatively steady but strong northward flow which can move at up to 1-2 metres per second across a width of 100 km or more and seemingly flowing along a path of 1000 km long. The circulation pattern we are studying is related, and has northward flowing water (including some of the Gulf Stream) which is relatively warm but also southward flowing water which is colder and (at subtropical and tropical latitudes) is underneath the northward flowing water.
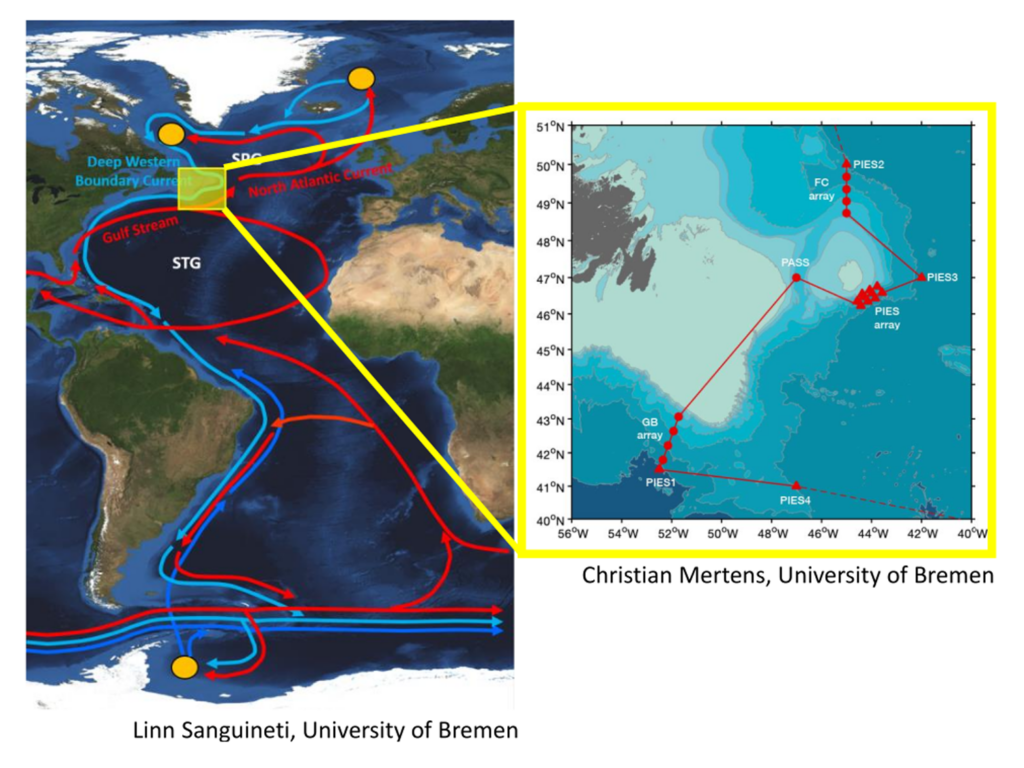
This large-scale circulation pattern is something that scientists call the “meridional overturning circulation”(we usually shorten it as MOC, pronounced “em-oh-see” rather than “mock”). It is also sometimes referred to as the ‘great ocean conveyor’ since it’s often drawn on maps of the ocean with red bands indicating warm water going northward, and blue bands for the cold water going southward, and these tend to be connected and look a bit like a conveyor belt that you might see at the supermarket (see map below).
However, the idea of the circulation pattern as a conveyor belt can be a bit misleading. It implies that when the water speeds up in one place (say, the northward flowing bit gets 50% faster) that it must speed up everywhere by the same amount. With the conveyor belt idea, you can’t have things speed up in just one area – the whole belt moves together. Oceanographers recently started measuring just how fast the water is moving, and making those measurements on repeat (every 10 days or every month) to see how the speed of the circulation varies in time.
What we found was surprising. First of all, this is not some slowly varying circulation, where it speeds up or slows down by only 5% in a year. Instead, we found that the circulation can range from 25% of the average, to double the average, within a single year. This was the first surprise, and generated a lot of interest to understand just why, exactly, the ocean circulation was so variable. But then, we also started measuring at various places along the conveyor belt. It started in the subtropical Atlantic, but measurements were then made further to the north (subpolar North Atlantic) and to the south (subtropical South Atlantic). It was then discovered that the fluctuations in the strength of the circulation really didn’t look like a conveyor belt at all, but that the currents appeared to speed up in one area, while slowing down somewhere else.
The EPOC project is called “Explaining and Predicting the Ocean Conveyor”. As part of the ‘explaining’ part, we are trying to understand whether and how the ocean behaves like a conveyor belt or not. Are some parts of it conveyor-like, even if not all? Or, if we look at the detailed processes involved in changing the rate of the circulation, can we find reasons for why the circulation looks different at different latitudes?
The MSM121 cruise is going to a particular place along the MOC at 47°N in the Atlantic. On land, this corresponds to a region in Canada which sticks out a bit to the east, and below the sea surface, an area called Flemish Cap sticks out even further. This region is a bit of a ‘pinch point’ in the Atlantic where it suddenly gets narrower – and simulations of the ocean circulation have shown that it’s tricky for the currents to smoothly navigate the sharply turning bathymetry. This region is also called the ‘pacemaker for decadal Atlantic variability’, where the ocean and atmosphere exchange heat and affect weather in Europe.
During this cruise, we plan to install a range of measurement sensors around the bend in topography. Our plan is to carefully document the changing currents – both in time (since these instruments will stay in this part of the ocean for 2 years) and in space (with measurements at various points around Flemish Cap) – and their properties (temperature and salinity). From these data, and also using data from other installations in the Atlantic and from satellites, we will piece together how the ocean circulation is connected (or how that connection is broken!) at the transition zone around 47°N in the Atlantic.
Below is a map showing the large-scale Atlantic ocean currents, and a zoom in on the Flemish Cap area, where we will be working. The map on the right shows the locations where we will deploy our instruments.
Home page | Expedition blog | Mission overview | Meet the team

EPOC is funded by the European Union. Views and opinions expressed are however those of the author(s) only and do not necessarily reflect those of the European Union. Neither the European Union nor the granting authority can be held responsible for them.