Specifically:
Understanding how the AMOC has changed in the past is important for understanding the AMOC’s role in climate and how it might change in the future. However, as direct observations of the AMOC only exist since 2004, we have to rely on other lines of evidence to understand how AMOC has changed over the 20th Century. Unfortunately, those other lines of evidence have significant disagreements on how the AMOC evolved over the 20th Century (see figure). However, they also have significant uncertainties. For example, low-resolution coupled climate models (including those used in the CMIP6) have known limitations and struggle to represent the variability of AMOC volume, heat and freshwater transports. Observationally, a range of proxies have been used to diagnose past AMOC variability (e.g., SST, sea level, western boundary velocities, upper ocean heat content), but a robust systematic evaluation of their utility has yet to be performed.
Therefore, in EPOC we will use high resolution historical simulations, compared with low resolution simulations, to evaluate the utility and robustness of different proxies of AMOC variability to reduce uncertainty on past AMOC variability (1850-present). Furthermore, we will perform new simulations with high-resolution coupled models in order to identify, and evaluate, the multivariate fingerprint of how greenhouse gas forcing impacts on the AMOC.
For the recent past (1993 – present), we will compare the best available modern oceanographic observations of AMOC variability to high resolution paleo proxies in order to assess their utility to reconstruct deep ocean circulation over the period 1850 – present.
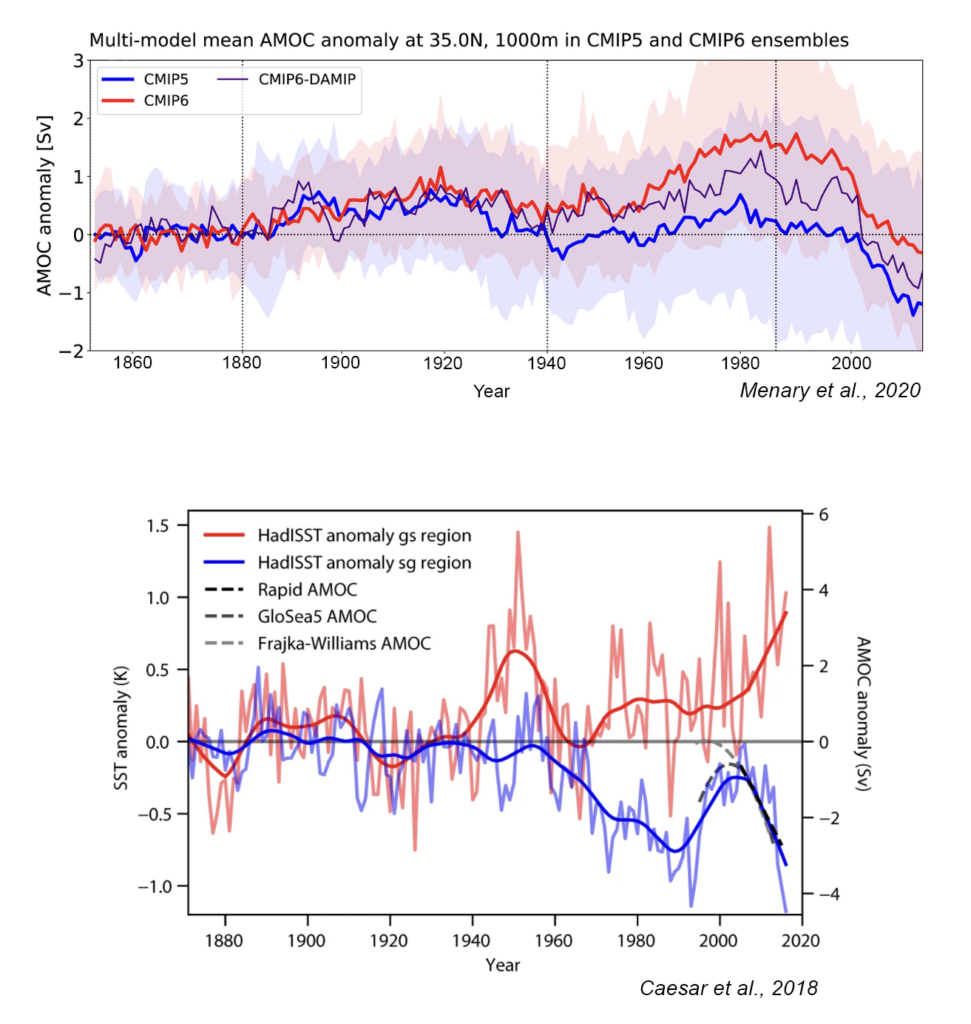
Above: Figures illustrating the mismatch in evidence from models and proxies about past AMOC trends. Top panel (from Menary et al., 2020) shows historical AMOC change in CMIP and indicates that AMOC has strengthened in the latest CMIP6 simulations: AMOC time series in CMIP5 (blue, comprising 39 models and 128 ensemble members) and CMIP6 (red, comprising 25 models and 133 ensemble members) multimodel ensembles. Also shown is the subset of seven CMIP6 models with DAMIP experiments (purple). Shading highlights one standard deviation of the multimodel (anomaly) ensemble. Lower panel (from Caesar et al., 2018) shows comparison of time series of SST anomalies and the strength of the overturning circulation in observations, which indicates that the AMOC has weakened substantially. Shown are time series of SST anomalies with respect to the global mean SST in the subpolar gyre (sg) and the Gulf Stream (gs) regions (HadISST data). The graph also includes the trend of in situ AMOC monitoring by the RAPID project, an ocean reanalysis product (GloSea5) and a reconstruction from satellite altimetry and cable measurements. Thin lines show individual years (November-May for SSTs) and thick lines show smoothed data (20-year LOWESS filtering for the SST data and quadratic/linear fits for the AMOC data).
References:
Menary, M. B., Robson, J., Allan, R. P.,Booth, B. B. B., Cassou, C., & Gastineau,G., et al. (2020). Aerosol‐forced AMOCchanges in CMIP6 historicalsimulations.Geophysical ResearchLetters,47, e2020GL088166. https://doi.org/10.1029/2020GL088166
Caesar, L., Rahmstorf, S., Robinson, A. et al. (2018) Observed fingerprint of a weakening Atlantic Ocean overturning circulation. Nature 556, 191–196. https://doi.org/10.1038/s41586-018-0006-5

EPOC is funded by the European Union. Views and opinions expressed are however those of the author(s) only and do not necessarily reflect those of the European Union. Neither the European Union nor the granting authority can be held responsible for them.