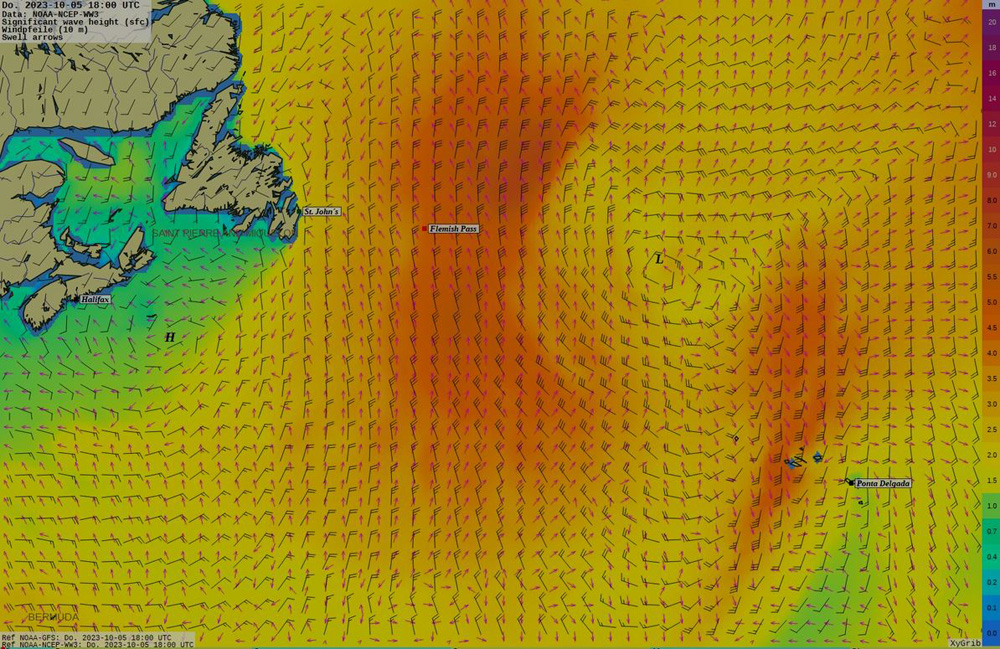
As mentioned in our previous post, we were certainly bracing ourselves for some challenging weather conditions, and boy, did we get just that! Thanks to a pesky low-pressure system, we found ourselves contending with waves that reached a staggering 8 meters in height, as beautifully depicted on the map (Figure 1). The different colours on the map, by the way, serve as a visual indicator of the significant wave heights in meters. For clarity, it’s worth noting that significant wave height represents an average of the largest 33% of waves.
Weather map showing wave height direction in the NW Atlantic on 5 October 2023. Based on NOAA-NCEP_WW3 data. Provided by MSM
In addition to these wave revelations, Figure 1 also showcases those nifty wind barbs, which ingeniously convey both the wind’s direction and its speed. Let’s decode the mysteries of those wind barbs:
Direction: The direction of the wind is indicated by the orientation of the barb. The stem of the barb points in the direction from which the wind is coming. For example, if the stem points to the northeast, it means the wind is coming from the northeast.
Speed: The number of barbs and their shape indicates wind speed. Each full barb represents a specific wind speed, and each half barb represents half of that value. Common scales used for wind barbs are meters per second (m/s). The number of full barbs, half barbs, or a combination of both represents the wind speed in increments of the chosen scale
Now, let’s turn our attention to those striking red arrows, much like the ones gracing Figure 1. They’re like nature’s way of pointing us in the direction of the swell. Swell, in oceanic terms, refers to a series of majestic, long-period waves that have embarked on epic journeys across vast stretches of open water. These swell waves owe their existence to distant weather phenomena, such as powerful storms or commanding winds, often originating hundreds, or even thousands, of miles away from where they make their awe-inspiring presence felt.
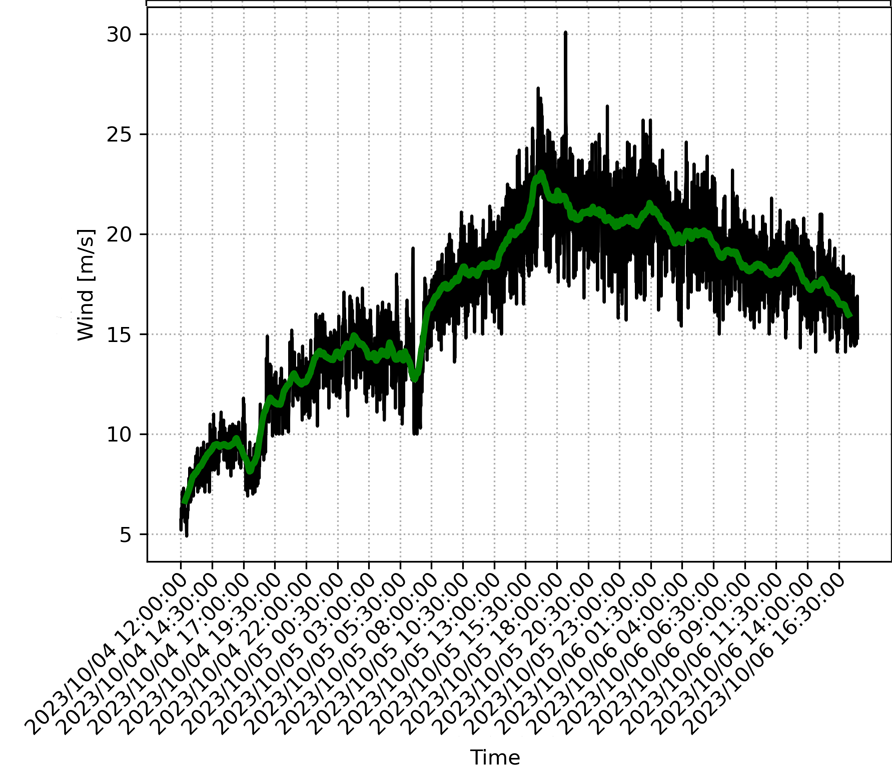
But, back to the nitty-gritty of our own shipboard experience. The wind speed, as dutifully measured aboard our trusty vessel, decided to kick things up a notch starting from Wednesday, with a modest 6 m/s, and culminating in a mighty crescendo at around 18:00 (Coordinated Universal Time or UTC) on Thursday, reaching a formidable 30 m/s. During this tempestuous period, we happened to be en route from our PIES array to Flemish Cap, which meant that no active fieldwork could be carried out amidst these relentless elements.
And speaking of measuring wind speed, there’s the venerable Beaufort Scale, a system forged by the illustrious British Rear Admiral Sir Francis Beaufort in the early 19th century. This timeless scale remains a trusted tool for gauging and articulating wind speeds based on real-world observations, be it out at sea or on the land. Originally conceived to assist sailors in assessing wind strength, the Beaufort Scale has since been embraced across various domains, including meteorology, aviation, and outdoor activities. In our own memorable encounter with the elements, we found ourselves squarely in the midst of a robust 11 Beaufort wind force during what we might affectionately term as our “prime time.”
Wind in m/s, which was measured on the ship. Black line: one min. data, green line 60 min. moving average
Wind in Bf, which was measured on the ship. Black line: one min. data, green line 60 min. moving average
Windy conditions! Video courtesy Eleanor Frajka-Williams